Debug React Native without the three-app shuffle.
Radar replaces React DevTools, Flipper, and Reactotron with one app. Console, network, profiler, performance, state, storage — plus a built-in MCP server so Claude and Cursor can debug for you.
Built for React Native developers
Everything you need
Eight powerful panels, one unified interface. No more switching between tools.
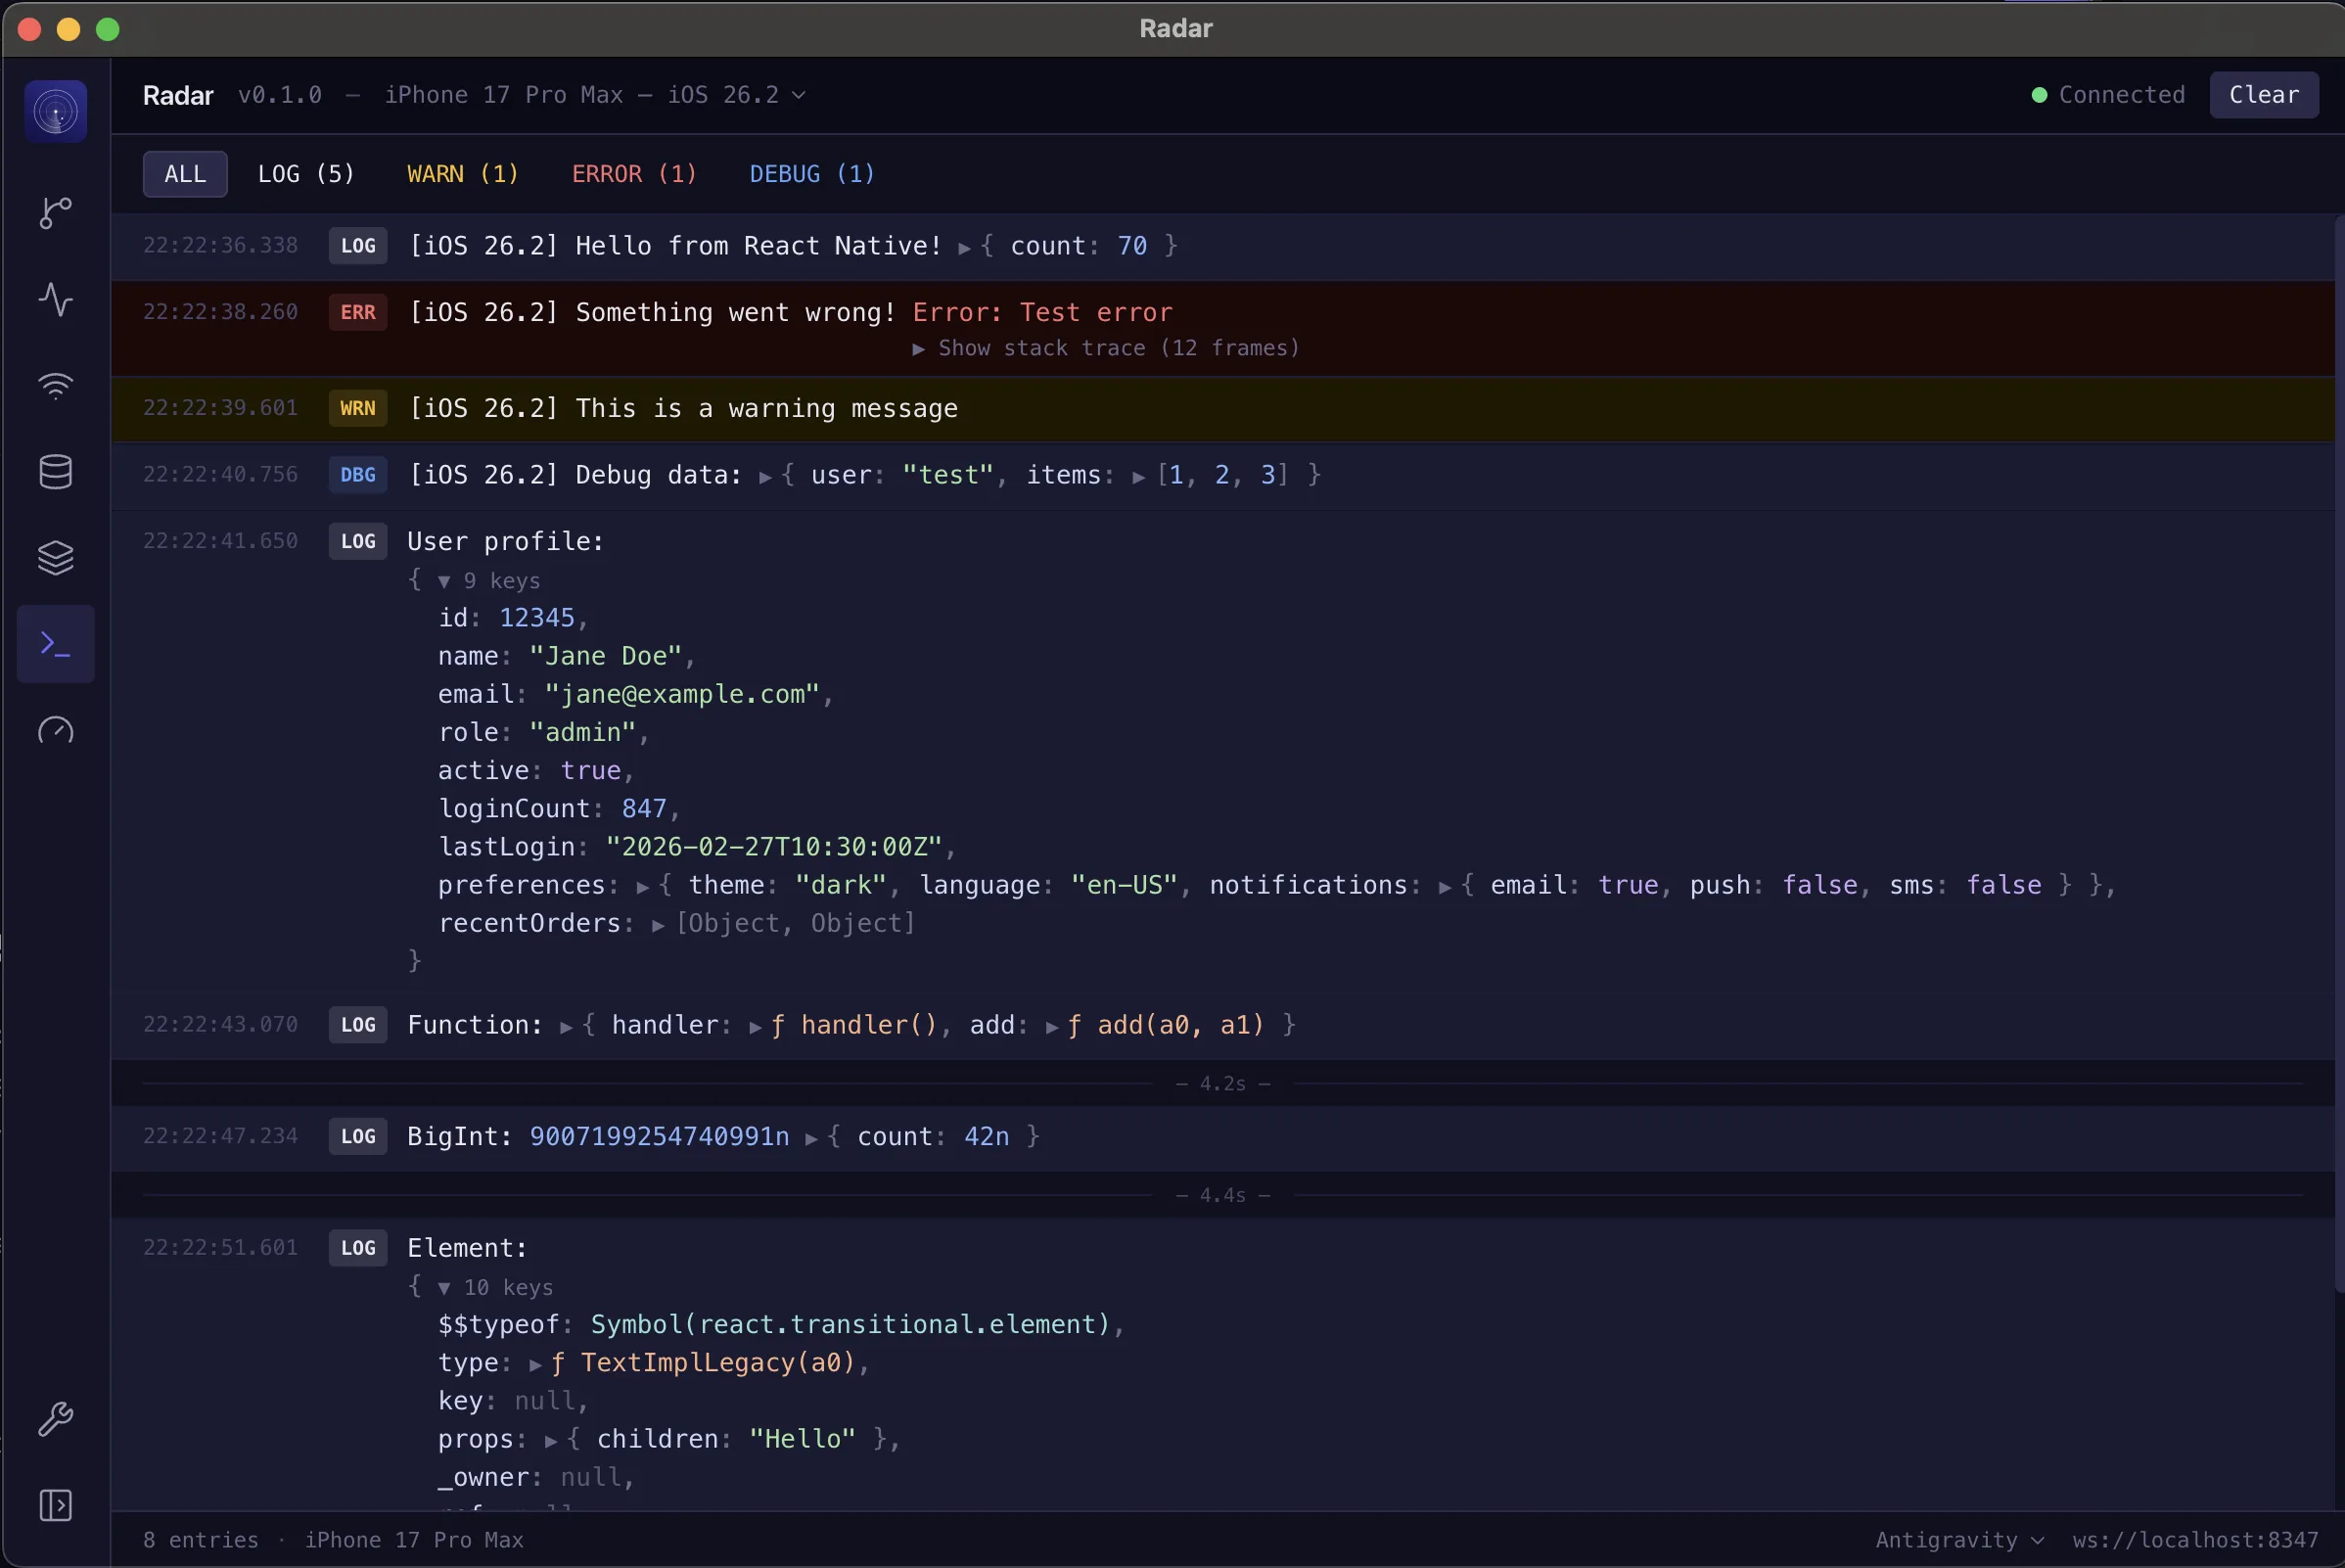
Console
Rich serialization for every type — functions, Symbols, BigInt, circular refs. Grouped logs, syntax highlighting, and stack traces.
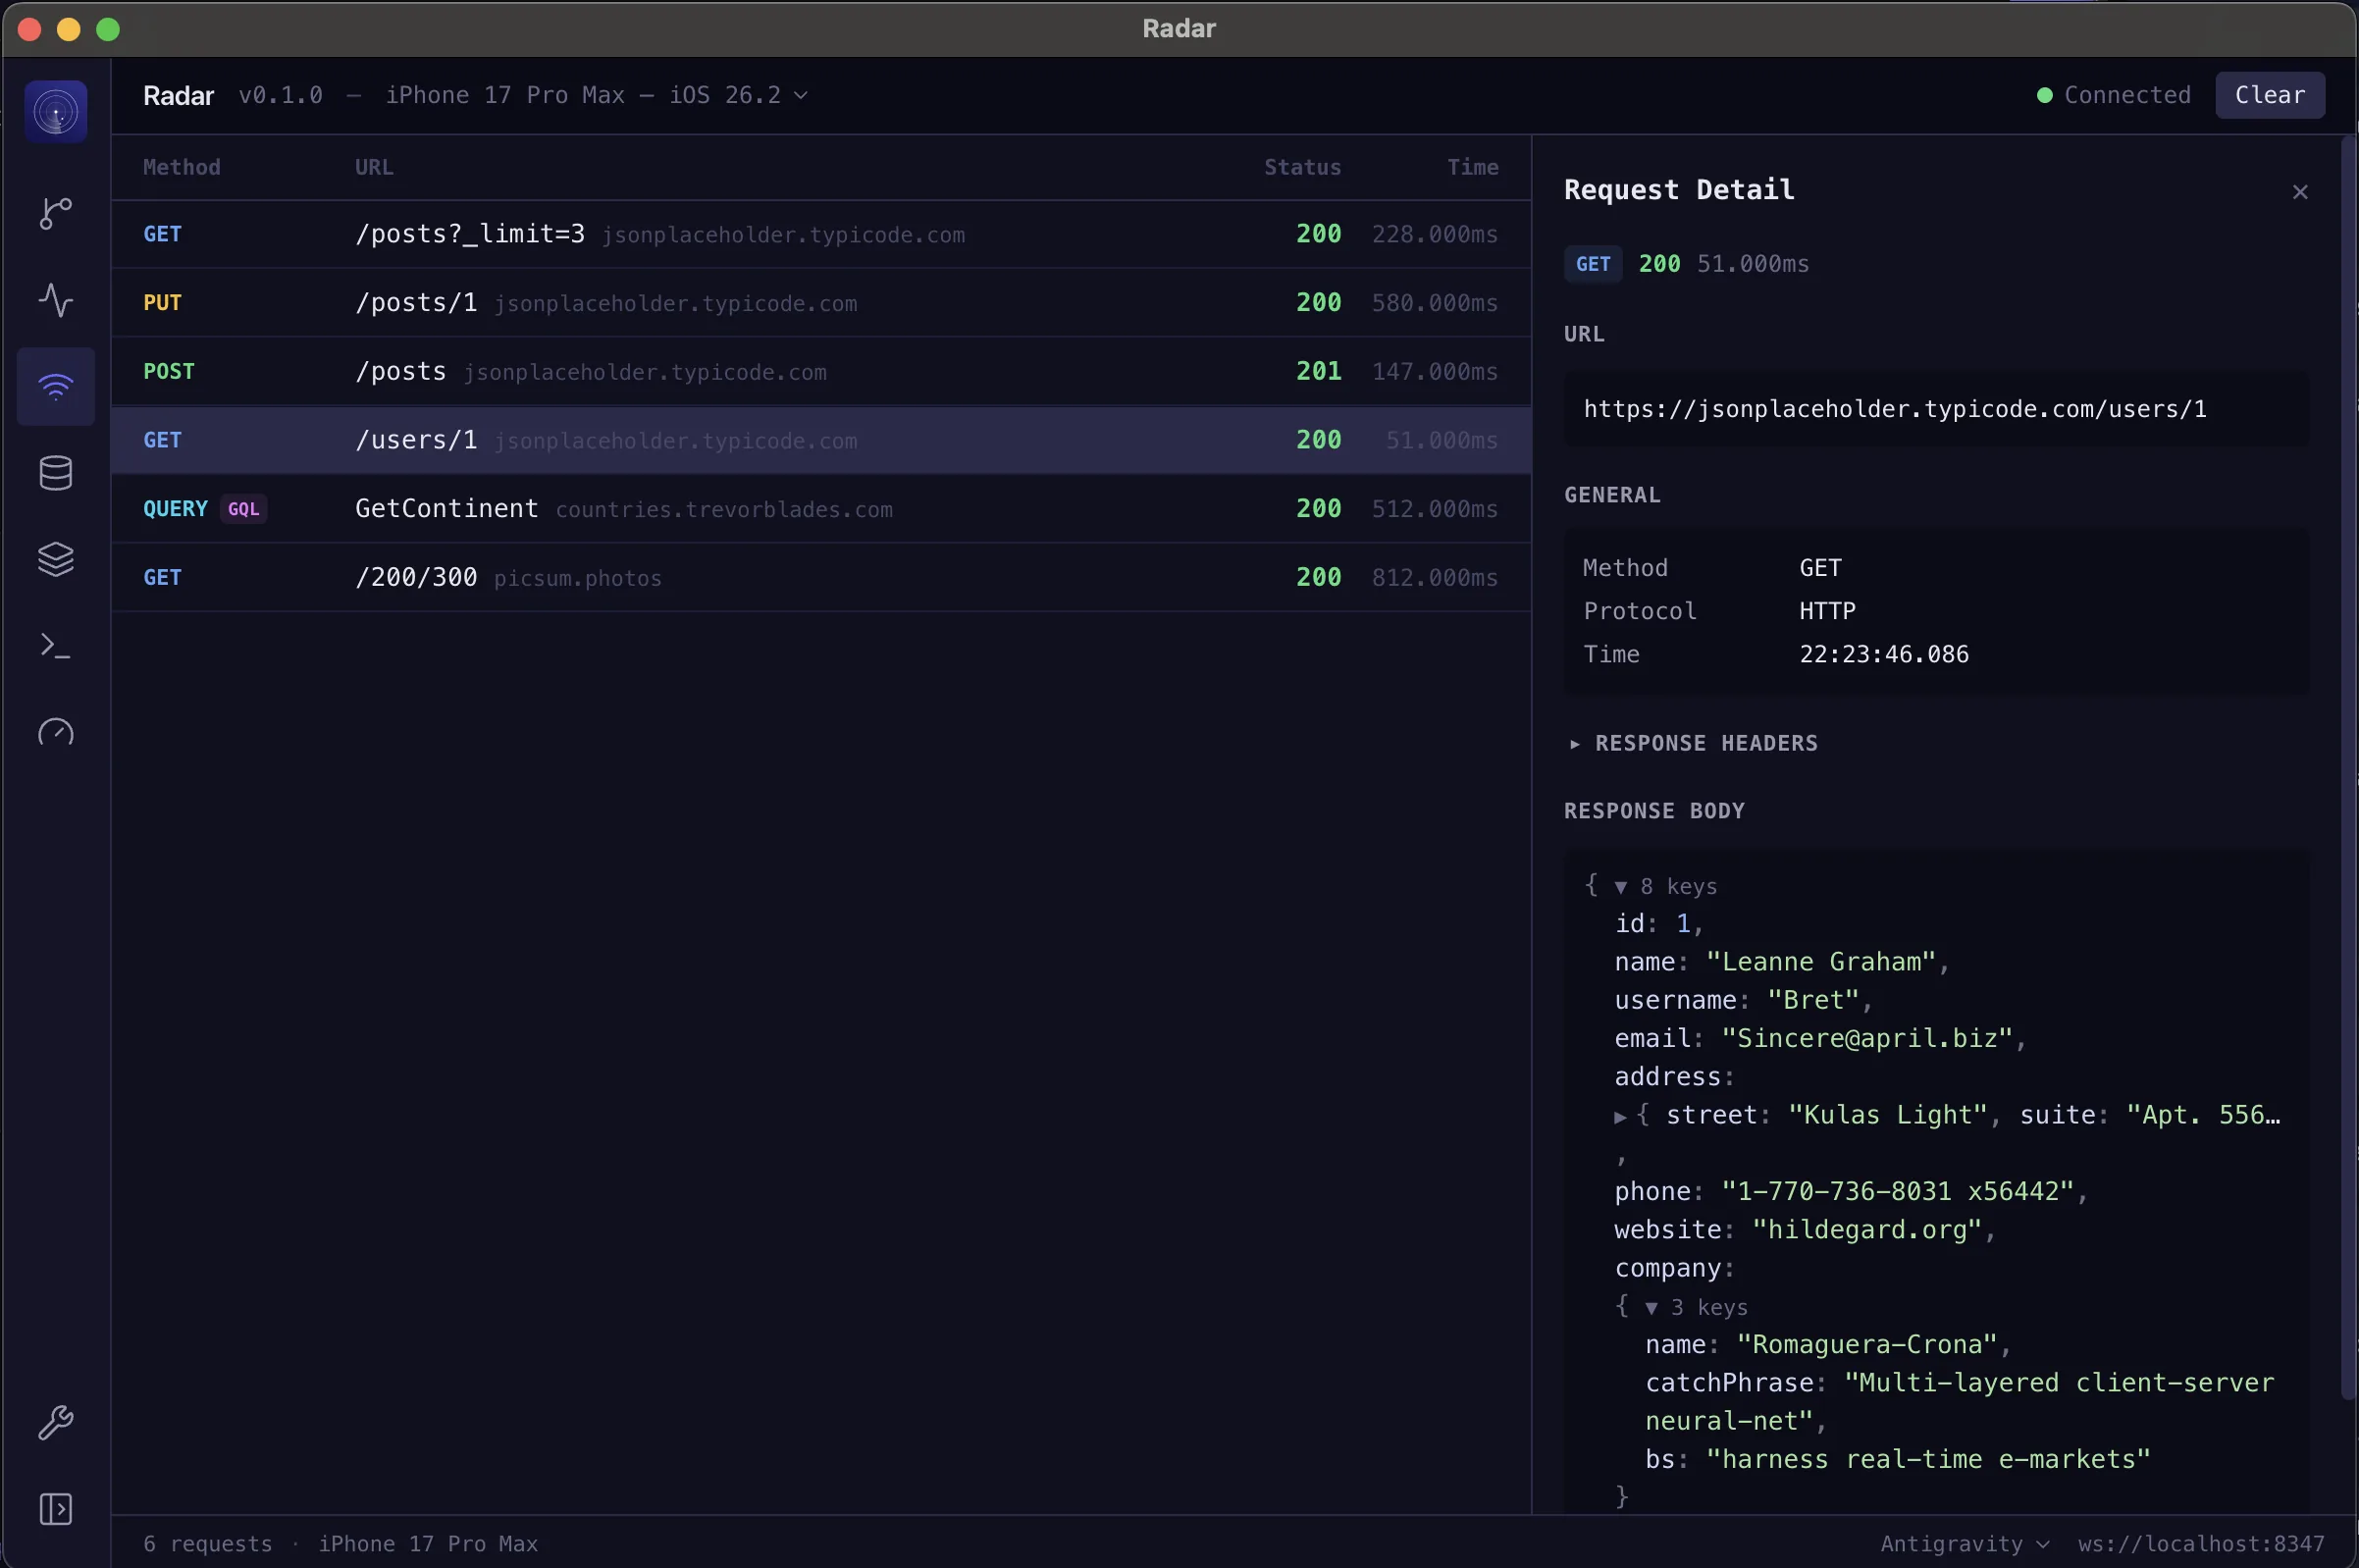
Network
Intercept every fetch request. Color-coded methods, request/response detail panel with headers and body inspection.
Component Tree
Fiber-based component inspection with search, source tracing, and full style resolution. See your app's structure in real time.
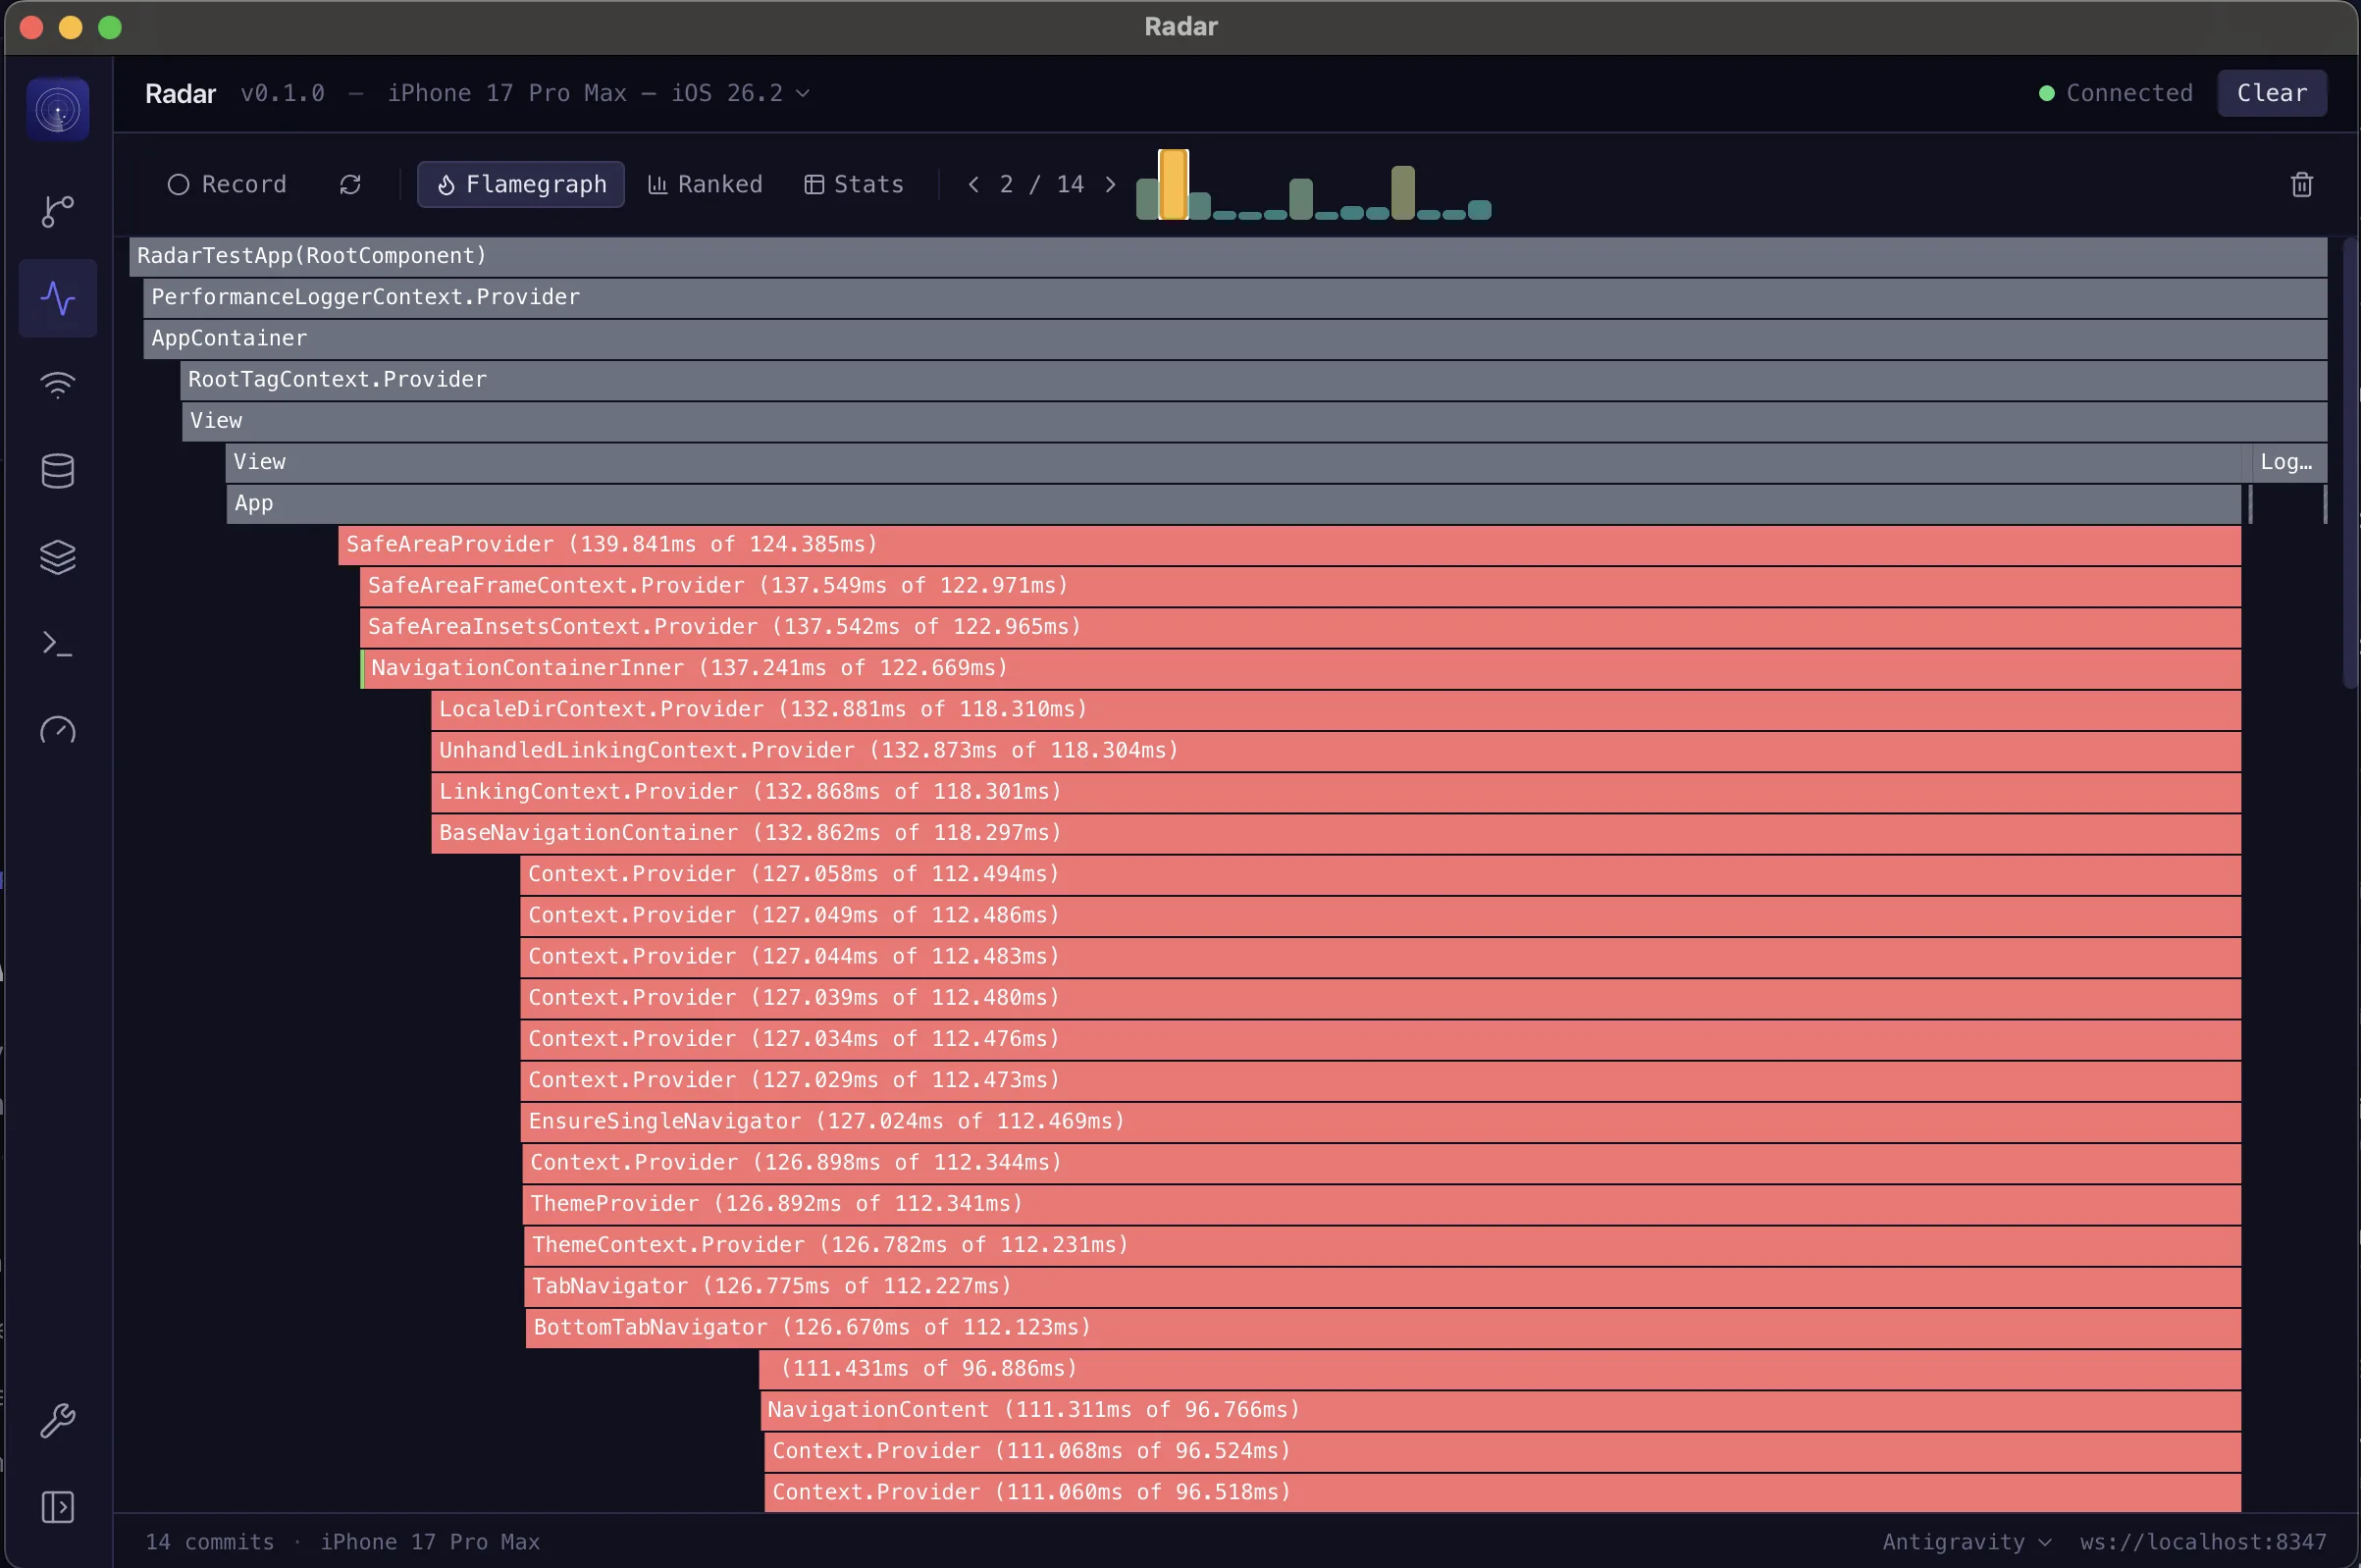
Profiler
Flamegraph visualization, ranked view, render trigger analysis showing exactly which props, state, or hooks caused re-renders.
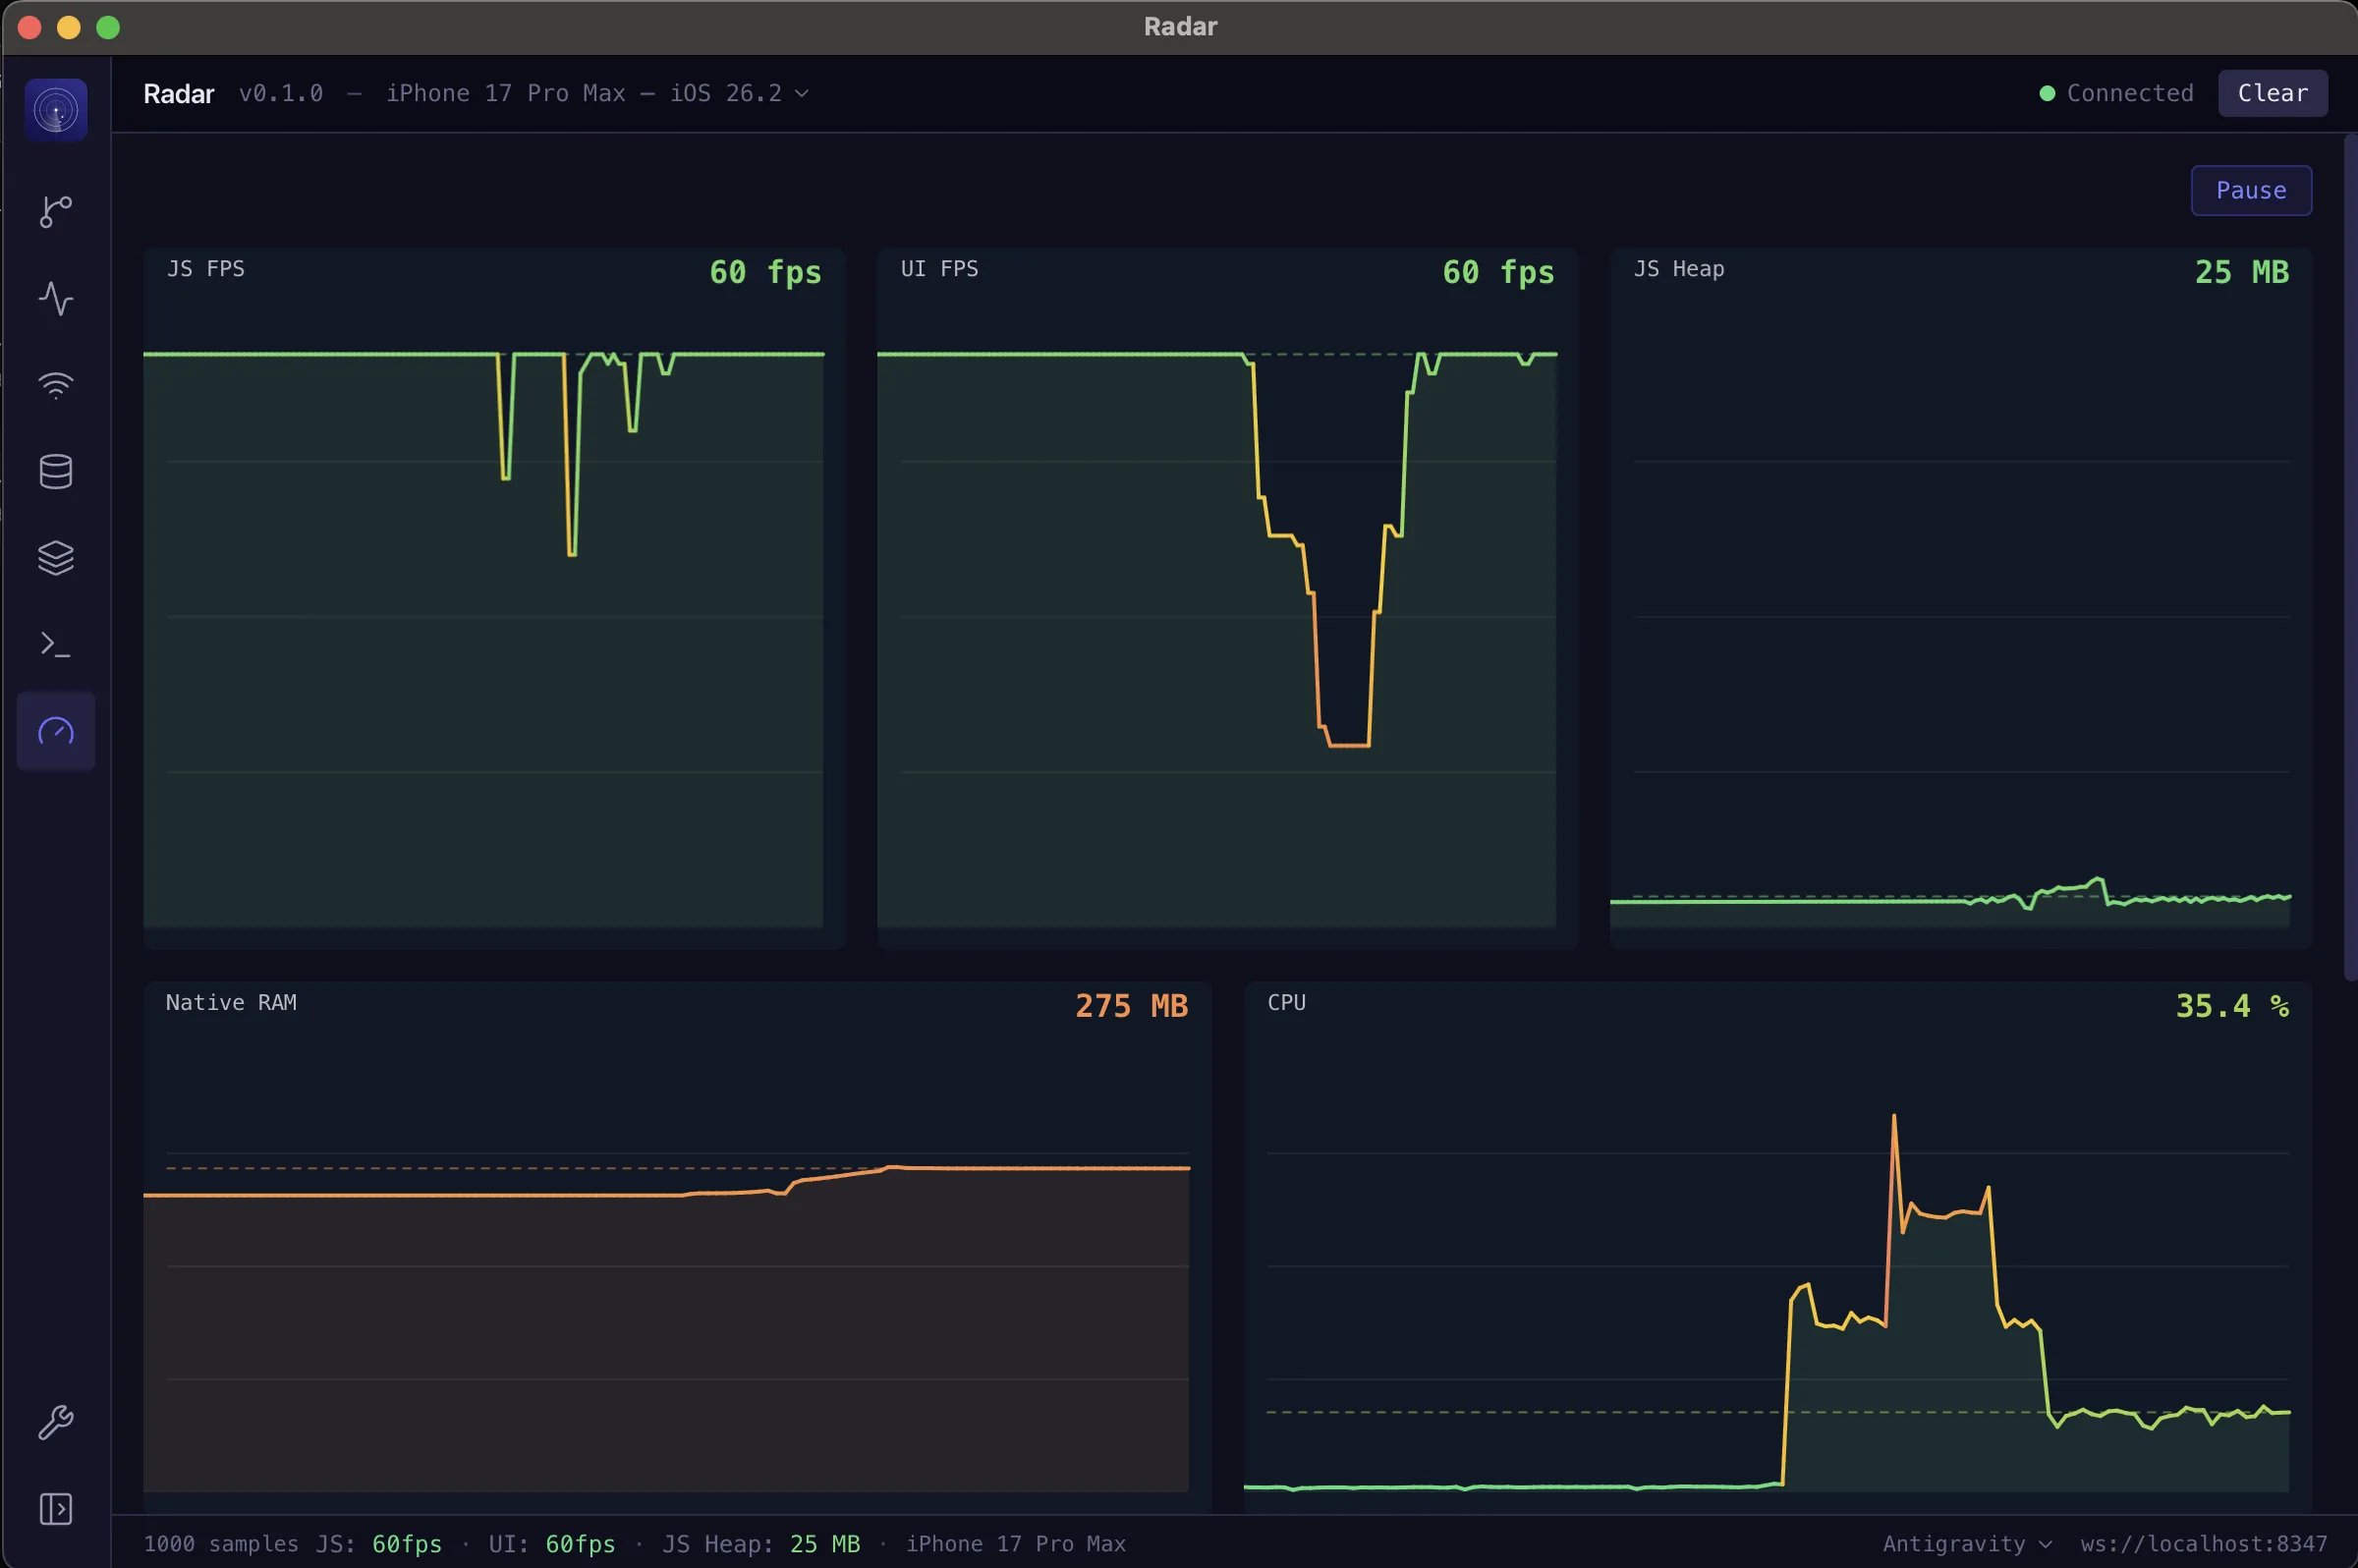
Performance
Real-time native metrics — UI FPS, CPU usage, memory, and JS heap. Startup breakdown with bundle eval, native launch, and TTI.
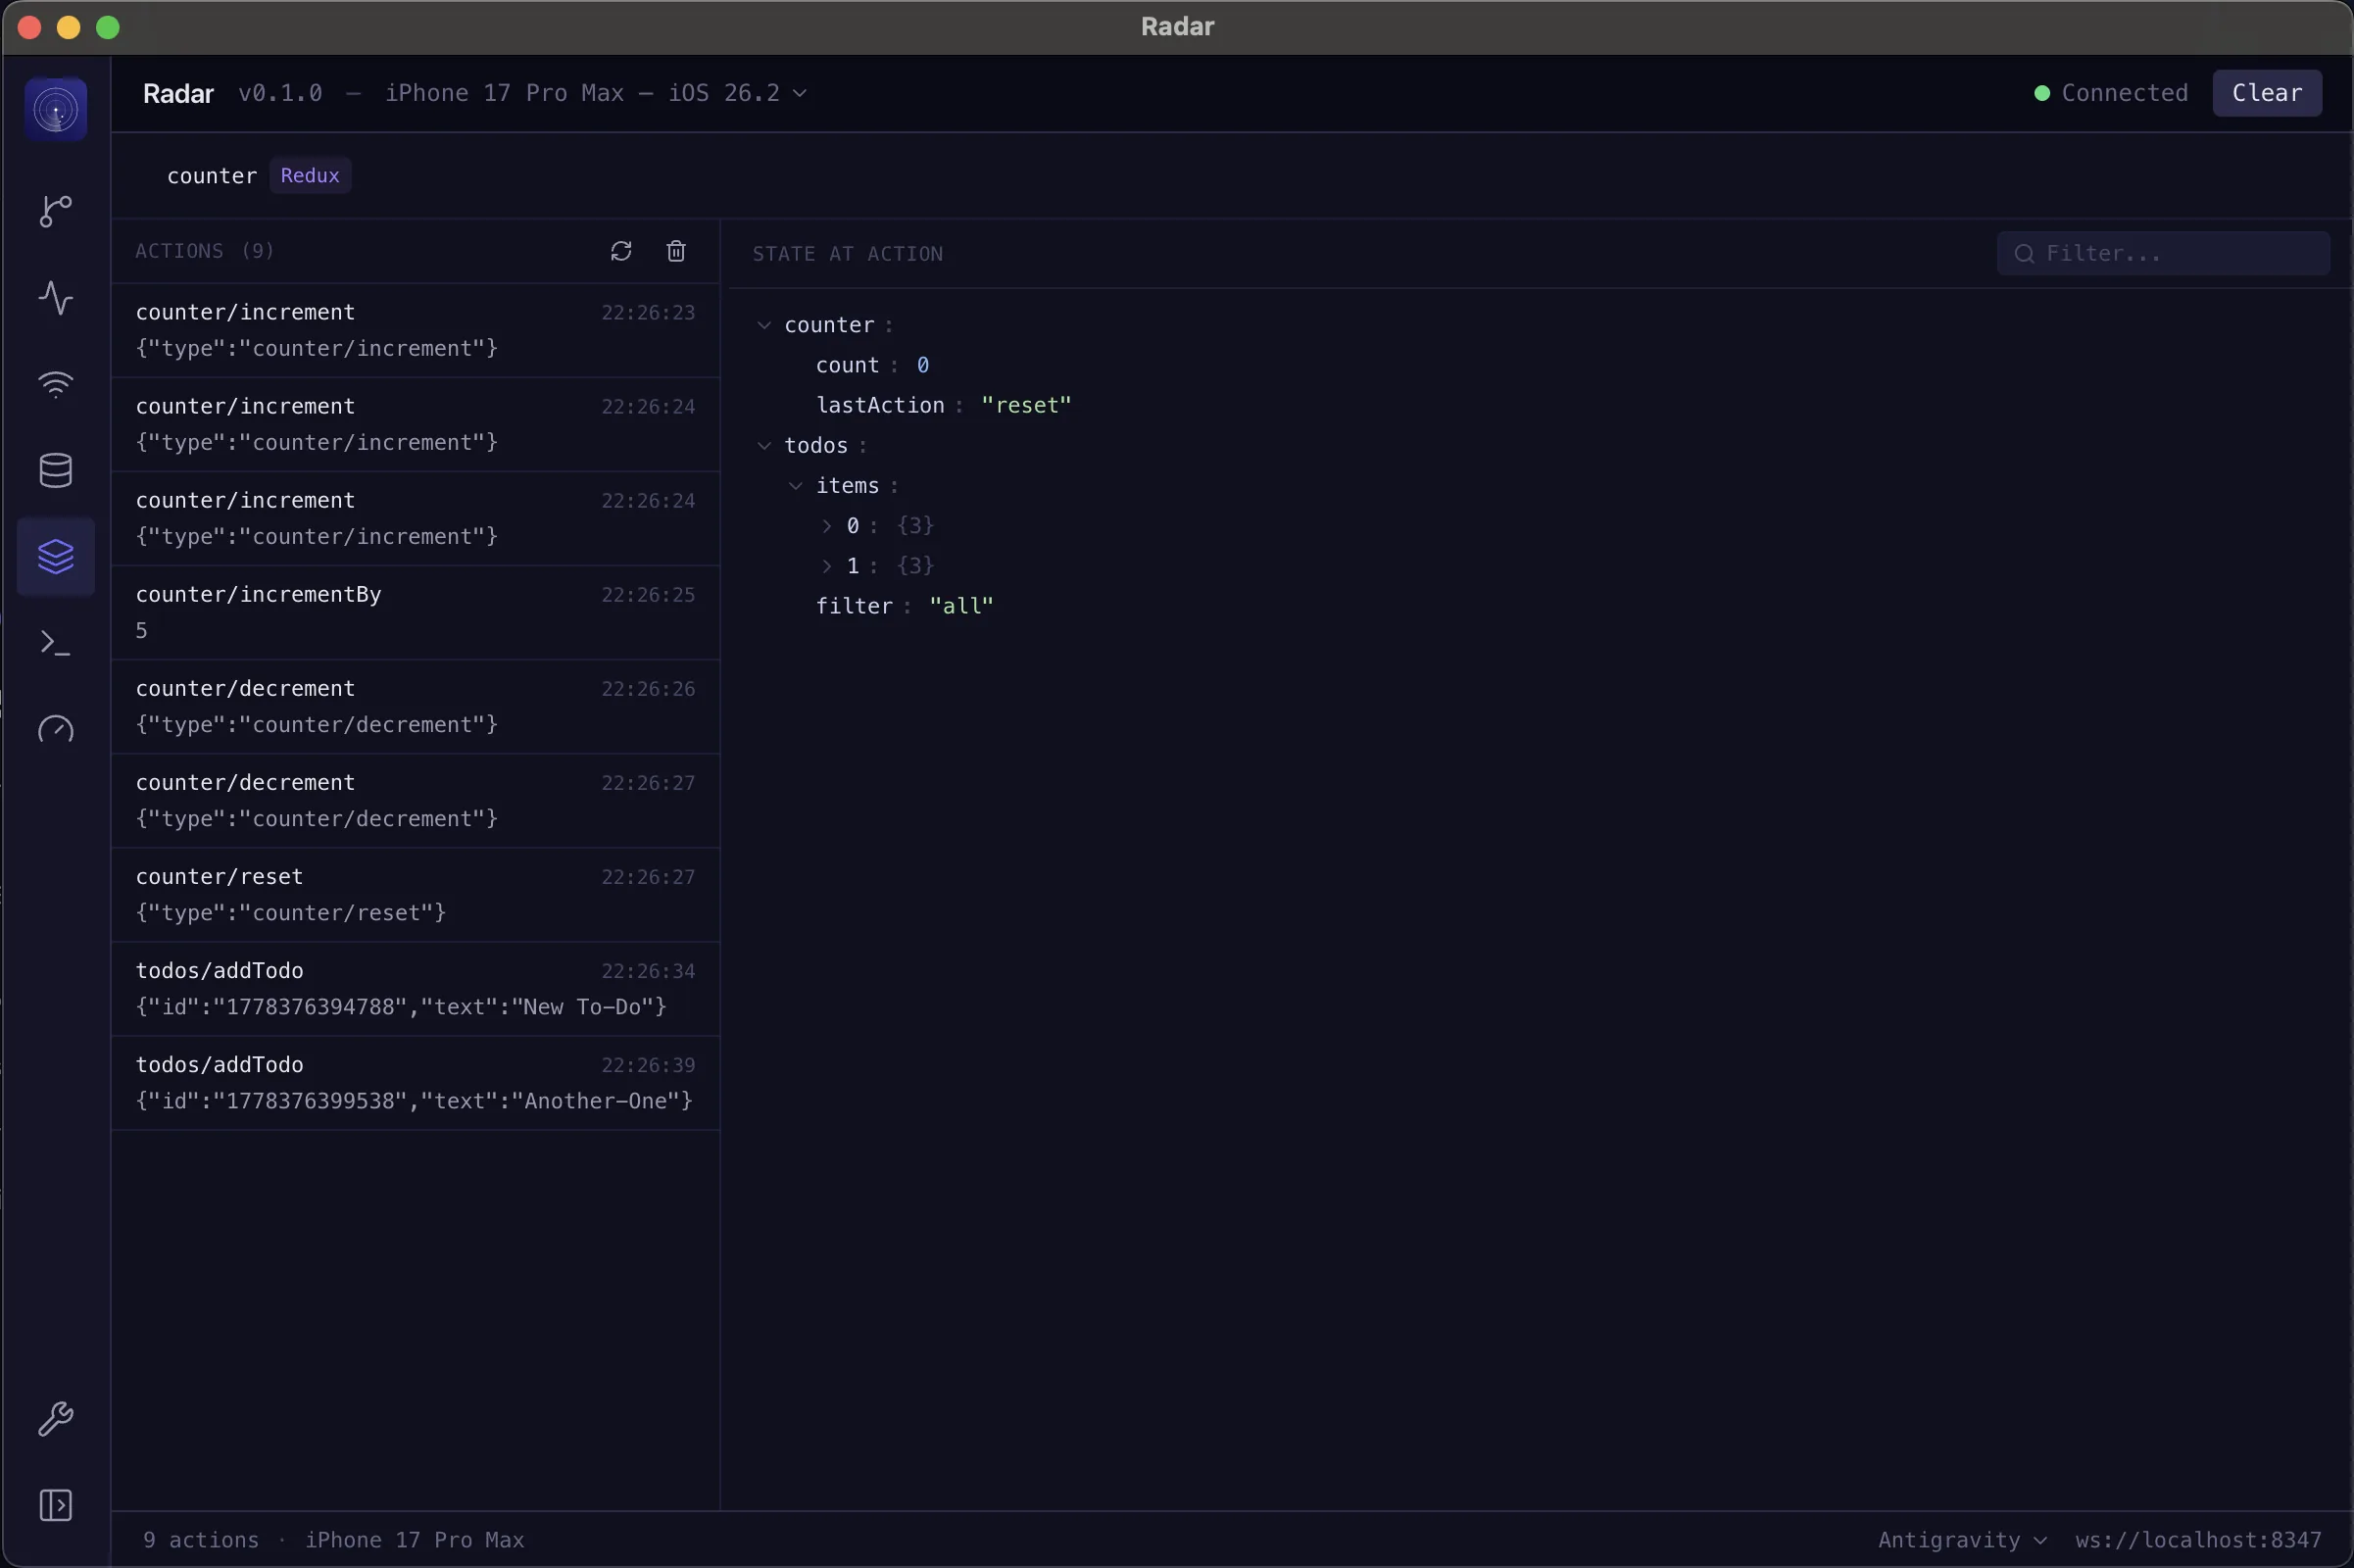
State Management
Inspect Redux, Zustand, and other stores in real time. View state snapshots, track dispatched actions, and filter by slice.
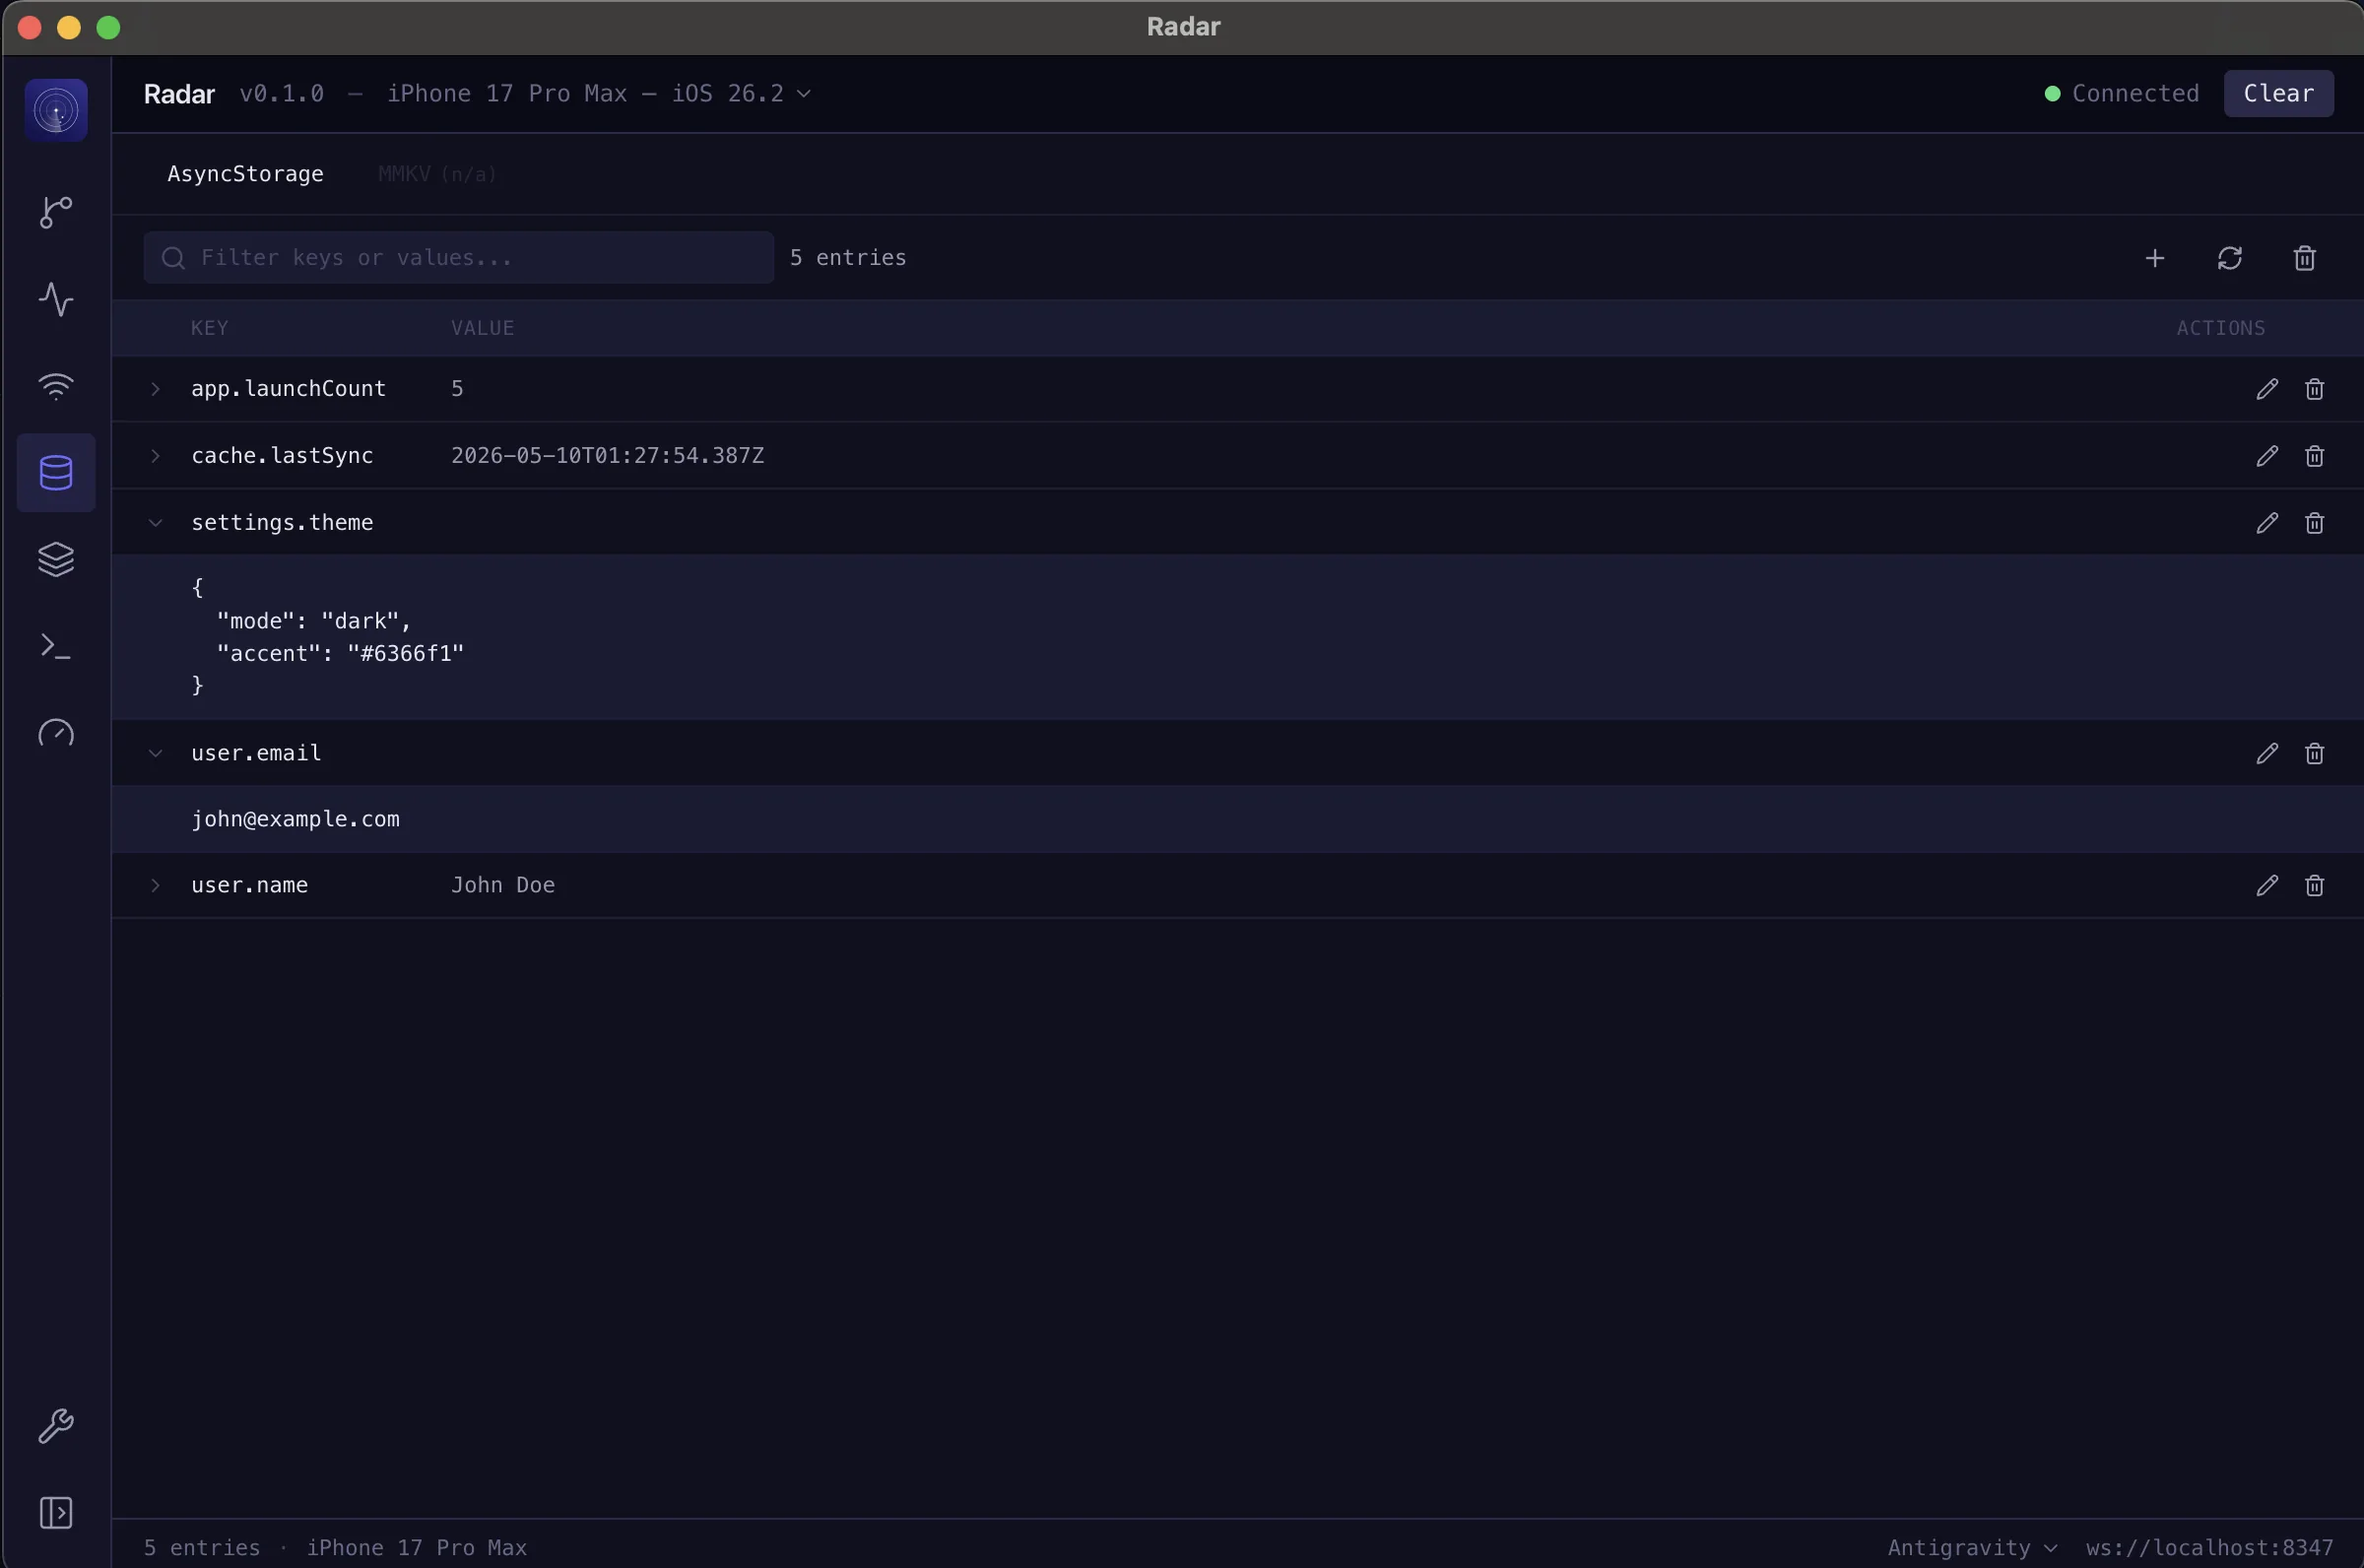
Storage
Browse, edit, and clear AsyncStorage and MMKV entries directly. Multi-instance MMKV support with typed values.
AI-Powered
Built-in MCP server exposes 18 tools to AI coding assistants. Let Claude, Cursor, or any MCP client debug your app for you.
See everything your app logs
Radar's custom recursive serializer captures what others can't. Functions, Symbols, BigInt, circular references, even React elements — all rendered with syntax highlighting and proper formatting.
- Rich serialization for non-JSON-safe types
- Log grouping and filtering by level
- Syntax-highlighted output with Catppuccin theme
- Full stack trace support
Every request, every response
Automatically intercepts fetch calls with zero configuration. See method, status, timing, headers, and full request/response bodies in a clean, color-coded interface.
- Automatic fetch interception
- Color-coded HTTP methods
- Request/response detail panel
- Headers and body inspection
Know why it re-rendered
Interactive flamegraph, ranked component view, and render trigger detection. See exactly which props changed, which state updated, and which hooks caused each render cycle.
- Interactive flamegraph visualization
- Render trigger detection (props/state/hooks)
- Ranked view for performance bottlenecks
- Commit timeline navigation
Skip Xcode and Android Studio for daily perf work
UI FPS, CPU, native RAM, JS heap, and a full startup breakdown — streamed live with hover inspection. The native metrics you used to open Xcode Instruments or Android Studio Profiler for, right next to your console and network panels.
- UI FPS, Native RAM, and CPU in real time — no IDE switching
- JS FPS and heap size tracking
- Startup breakdown: bundle eval, native launch, TTI
- Pause, hover, and inspect any moment in time
Your stores, fully transparent
Connect to Redux, Zustand, or any state management library and see the full picture. Browse state snapshots, filter by slice, and replay dispatched actions to understand exactly how your app's data flows.
- Redux, Zustand, and custom store support
- Live state snapshots with slice filtering
- Action history with payload inspection
- Diff view between state changes
Read and write device storage
Inspect AsyncStorage and MMKV entries without leaving Radar. Browse keys, edit values in place, or clear entire backends. Multi-instance MMKV is fully supported with typed values.
- AsyncStorage and MMKV support
- Edit values and delete keys in real time
- Multi-instance MMKV with typed values
- Clear entire storage backends instantly
Let AI debug for you
Radar ships a built-in MCP server with 18 tools for any AI coding assistant. Claude, Cursor, Windsurf, or any MCP client can read your app's runtime data and act on it.
One line to connect
Add Radar as an MCP server in your AI tool's config. That's it — your assistant can now see everything your app does at runtime.
claude mcp add radar --transport http http://localhost:8348/mcp.claude/settings.json
{
  "mcpServers": {
    "radar": {
      "url": "http://localhost:8348/mcp"
    }
  }
}Observe
10 toolsRead console logs, network requests, component trees, profiler data, and performance metrics
Inspect
5 toolsDive into component props, state snapshots, storage entries, and startup metrics
Act
3 toolsModify storage, start/stop profiling, reload and profile, refresh state, and reset data
“Why is my app re-rendering so much?”
AI reads profiler data, identifies triggers, and suggests fixes
“Show me all failed network requests”
AI filters requests by status code and highlights errors
“What does the Redux state look like for the todos slice?”
AI reads the state snapshot and returns the current slice data
Get started in seconds
Three steps. That's it.
Install
Add the devtools package to your React Native project.
npm install radar-devtoolsInitialize
Import and call init in your app's entry point.
if (__DEV__) {
  const { init } = require('radar-devtools');
  init();
}Debug
Open the Radar desktop app and start debugging. Your app connects automatically.
How Radar compares
One tool to replace them all.
| Feature | Radar | React DevTools | Flipper | Reactotron |
|---|---|---|---|---|
| Console | ||||
| Network Inspector | ||||
| Component Tree | ||||
| Profiler | ||||
| State Management | ||||
| Storage Inspector | ||||
| Source Tracing | ||||
| Style Inspection | ||||
| Native Performance Metrics | ||||
| No Xcode / Android Studio switching | ||||
| Startup Analysis | ||||
| AI Integration (MCP) | ||||
| Multi-Device | ||||
| Unified UI |
Debug any device, any platform
Seamless multi-device debugging for iOS and Android.
Auto-Detection
Radar automatically discovers devices on your network.
Multi-Device Selector
Switch between connected devices with a single click.
Per-Device Filtering
Filter logs and network requests by device.
Stop juggling debugging tools.
Radar puts console, network, profiler, state, and storage in one desktop app. Plus AI integration when you want it.